In [55]:
dfrapt4["Adj Close"].plot(figsize=(15,8))
plt.legend()
plt.grid();

import pandas as pd
from pandas_datareader import data as web
import matplotlib.pyplot as plt
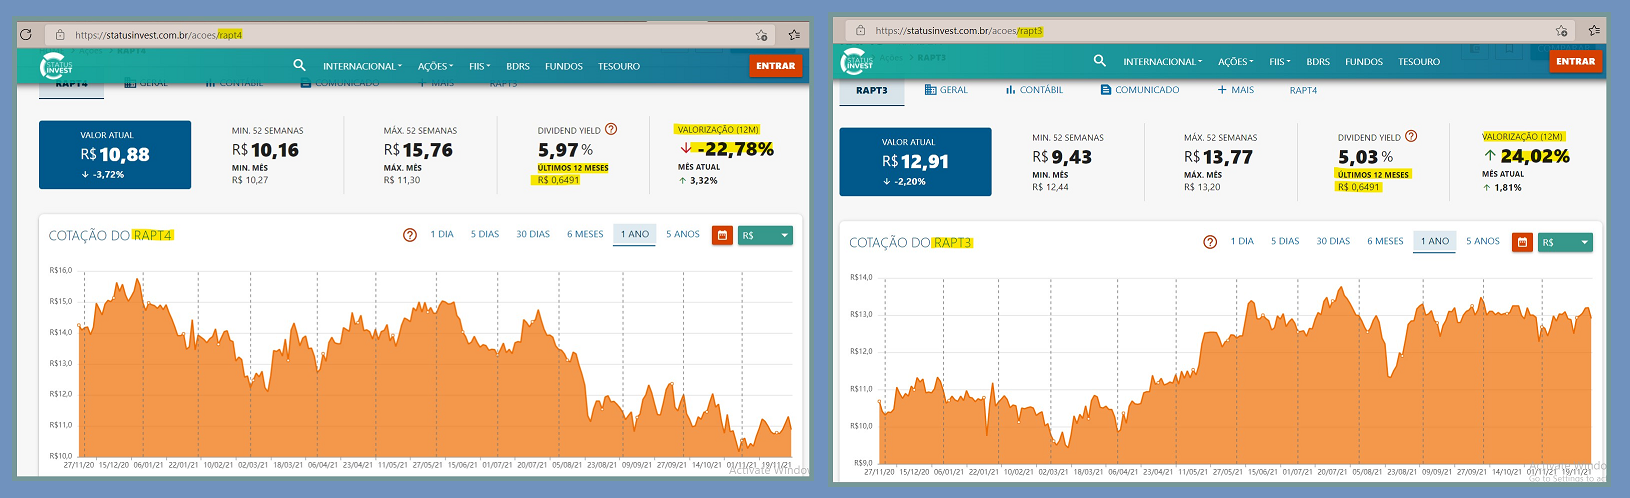
dfrapt4 = web.DataReader('RAPT4.SA', data_source="yahoo", start = '12-01-2020', end = '11-26-2021')
display (dfrapt4)
| High | Low | Open | Close | Volume | Adj Close | |
|---|---|---|---|---|---|---|
| Date | ||||||
| 2020-12-01 | 14.95 | 14.41 | 14.72 | 14.78 | 5062800.0 | 14.144197 |
| 2020-12-02 | 14.93 | 14.43 | 14.82 | 14.80 | 2791100.0 | 14.163337 |
| 2020-12-03 | 15.06 | 14.55 | 14.90 | 14.55 | 2349300.0 | 13.924091 |
| 2020-12-04 | 14.88 | 14.51 | 14.67 | 14.79 | 2783700.0 | 14.153768 |
| 2020-12-07 | 15.89 | 14.71 | 14.83 | 15.59 | 6978400.0 | 14.919353 |
| ... | ... | ... | ... | ... | ... | ... |
| 2021-11-22 | 11.18 | 10.66 | 10.90 | 10.75 | 1465900.0 | 10.750000 |
| 2021-11-23 | 10.91 | 10.45 | 10.86 | 10.87 | 2323700.0 | 10.870000 |
| 2021-11-24 | 11.19 | 10.62 | 10.76 | 11.08 | 1659300.0 | 11.080000 |
| 2021-11-25 | 11.43 | 11.04 | 11.08 | 11.30 | 1792300.0 | 11.300000 |
| 2021-11-26 | 10.98 | 10.59 | 10.91 | 10.88 | 2149000.0 | 10.880000 |
235 rows × 6 columns
dfrapt4["Adj Close"].plot(figsize=(15,8))
plt.legend()
plt.grid();
dfrapt3 = web.DataReader('RAPT3.SA', data_source="yahoo", start = '12-01-2020', end = '11-26-2021')
display (dfrapt3)
| High | Low | Open | Close | Volume | Adj Close | |
|---|---|---|---|---|---|---|
| Date | ||||||
| 2020-12-01 | 11.28 | 10.65 | 10.65 | 10.88 | 12600.0 | 10.298683 |
| 2020-12-02 | 10.96 | 10.88 | 10.95 | 10.96 | 2800.0 | 10.374408 |
| 2020-12-03 | 11.26 | 10.95 | 10.96 | 10.95 | 6900.0 | 10.364944 |
| 2020-12-04 | 11.28 | 10.91 | 11.28 | 11.04 | 1500.0 | 10.450134 |
| 2020-12-07 | 11.83 | 11.00 | 11.05 | 11.67 | 56700.0 | 11.046474 |
| ... | ... | ... | ... | ... | ... | ... |
| 2021-11-22 | 13.13 | 12.66 | 12.93 | 12.80 | 12800.0 | 12.800000 |
| 2021-11-23 | 13.10 | 12.83 | 13.10 | 13.05 | 3900.0 | 13.050000 |
| 2021-11-24 | 13.14 | 13.05 | 13.05 | 13.14 | 3200.0 | 13.140000 |
| 2021-11-25 | 13.20 | 12.85 | 13.09 | 13.20 | 1700.0 | 13.200000 |
| 2021-11-26 | 13.06 | 12.54 | 12.91 | 12.91 | 10000.0 | 12.910000 |
235 rows × 6 columns
dfrapt3["Adj Close"].plot(figsize=(15,8))
plt.legend()
plt.grid();

dfrapt4["Adj Close"].plot(figsize=(20,5), label="RAPT4")
dfrapt3["Adj Close"].plot(figsize=(20,5), label="RAPT3")
plt.legend()
plt.grid();